
When trying to choose a dataset for experimentation, nothing made more sense than to dive into the numbers behind major league baseball. The dataset is composed of the statistics for each MLB team over six seasons worth of games (2012-2018). These statistics include variables such as total errors, total home runs, ERA, total RBI’s and many more. However, the most important part of the data is the teams total wins, losses and win-loss percentage for each team.
This dataset helps pose the question “Could using the bare bone stats for each team (such has errors, home runs, ERA, etc..) help find a correlation between wins and losses and determine which teams would have more wins?”. Also using this data I look to possibly discover “Which baseball statistic is the largest factor in determining amount of wins?”, if there is even one statistic that can prove this at all.
Now let me explain why I chose this data set. As said in my welcome blog, I am a big baseball fan. My passion for baseball does not start and stop with the New York Yankees. I enjoy watching other teams and diving myself into their numbers and rosters.
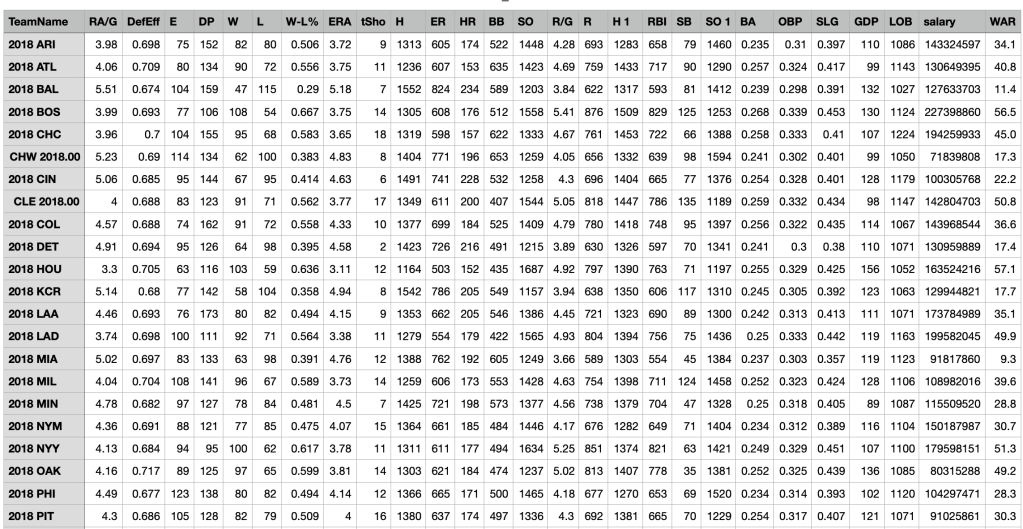
Here is a smaller snapshot of the data set showing all the statistics per team. As you can see, there is much data that comes out of a baseball season. There must be some way that wins and looses can be predicted using all those numbers.
