
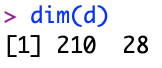
Today I will be using R to dive into the statistics of past MLB seasons. For this project, I will utilize data from the 2012-2018 seasons. First, Ill check the dimensions of the data set using the first row.

As shown in the snapshot above, you can see that there are 27 variables (NOT including team name) present in the set. When looking to find how many individual observations are reported in the data set, I was able to find 210 individual observations.
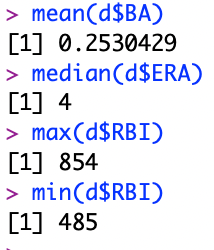
An easy way to begin to understand your data is by finding the mean, median, max, and minimum of certain variables. For example, one of the most important statistics in baseball is batting average. Using R, I was able to calculate that there was a mean cumulative batting average of .253 among all teams. Another important statistic, ERA, had a median of 4 across all the teams. This means that the median earned runs per game was 4. If you score a lot you can predict (somewhat) that you will win a good amount of games. Using the “max” function within R I was able to find the maximum amount of runs scored in a season (RBI) was 854 and the minimum was 485.
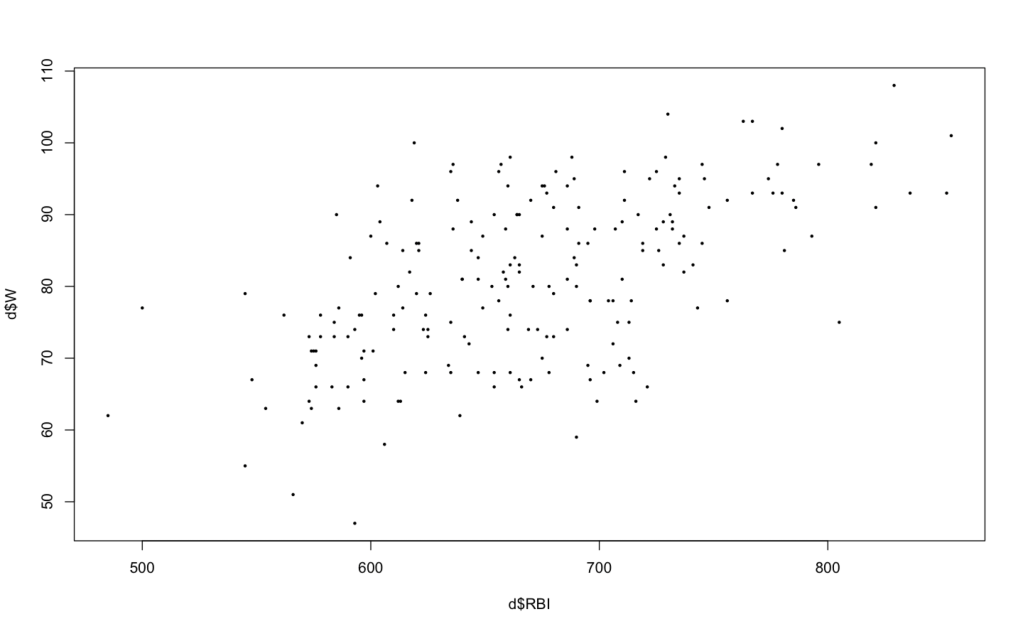
Now here is a scatter plot showing the correlation between RBI’s and Wins (W). As you can see, higher RBI’s correlates to a higher amount of wins while lower RBI’s usually has lower wins.
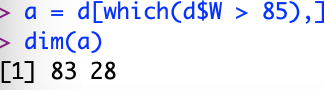
So now the question is raised, is there a way to isolate certain team seasons based on wins? Teams with above 85 wins in a season have the highest chance of making it to the playoffs. By cutting the data set down to teams with over 85 wins, we are able to see their relative variables. After preforming the calculations it was determined that there was 83 instances where a team won more than 85 games in a season between 2012-2018.
Using all this data, a continuous variable that I will try to predict using other variables is a teams wins. This also begs the question, “Do teams with more RBI’s and a higher batting average end the season with more wins?”. I can answer this question with an enthusiastic yes!
