
There might not be a single more important statistic in baseball than batting average. If you aren’t too keen on baseball, batting average is the average amount of times you get a hit. For example, if you get 3 hits out of 10 at bats your average is .300. If you get 2 hits out of 10 at bats your average is .200. Year after year data shows that teams that have a higher batting average (hit more) have more wins.
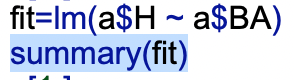
Using R I was able to find my intercept and slope of the linear relationship between batting average and wins. Using the fit=lm() function I set wins as the dependent variable and batting average as the independent variable.
Then R printed out the data showing a Y intercept of -25.61 wins and a slope of 421.28. Even though having a negative intercept, the slope has highest significance meaning that this line best fits the data.
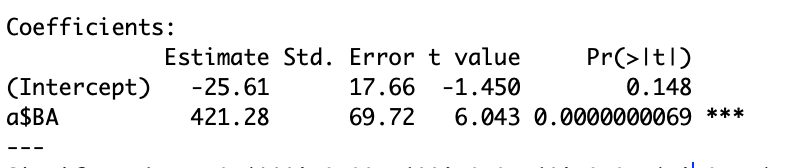
This helps create the model equation of Y= -25.61+421.28x. When plugging a number in for x, such as .065, you get 1.77. Having this new Y variable means that for every .065 increase in batting average there is an increase of about 27.38 wins. While increasing a batting average by .065 is unrealistic in the real world, it helps illustrate that the line of best fit does eventually make it into positive territory. The model equation requiring unrealistic inputs points to the fact that batting average might not be the best predictor when it comes to team wins. A better predictor would be a variable that doesn’t require unrealistic changes in order to give a positive result.
