Using data from six MLB seasons, I am attempting to predict wins using other variables such as batting average. In order to do this you must first generate a linear regression model using R. The model that best represents this relationship with my data is Y=-25.61+421.28x, with -25.61 being the intercept and 421.28 being the slope. This means that, for example, a .065 increase in the team batting average will yield around 27.38 more wins. To ensure this regression is accurate, I preformed a significance test. To do this I first ran linear regression code to give me my intercept and slope.
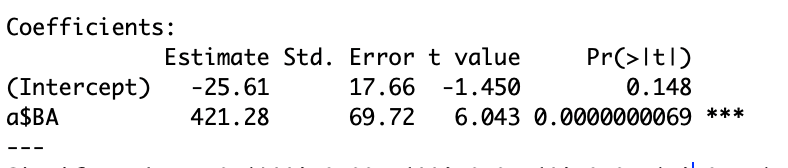
From this photo of the result you can see the three stars next to the slope. Because the value is less than .05, that means that the slope of the line is statistically significant.
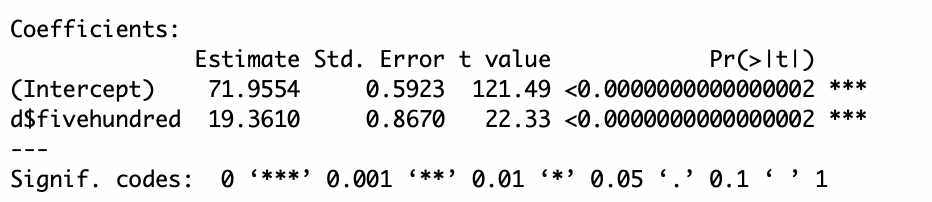
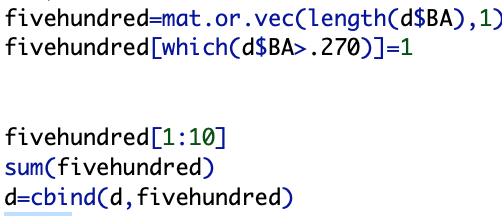
Now I created a binary variable in my dataset to help show a relationship occurring and wins a team will have. The binary variable I created was “fivehundred” to showcase teams that have a batting average above .270. Then using the sum function I was able to see that there was 121 instances where a team hit above .270 in a season.
Using this new binary X variable I then used code to retrieve the coefficients for this new relationship. There was a new intercept of 71.95 wins and a slope of 19.36. The model equation relating to these coefficients is Y=71.95+19.36x. This means that batting average stays at .270, a team can be predicted to win 71-72 games. However, when a team increases its batting average to .300 (up .030) it can be predicted to win 73 games. Also, both intercept and slope are statistically significant meaning that there is a strong relationship between wins and a binary batting average.