
When using R to analyze data you often generate a linear regression model to find a relationship (or predict a relationship) between two variables. For my MLB data, I am attempting to predict team wins off of batting average. After using the fit=lm() command, which I explained in the last blog, I was left with the following results.
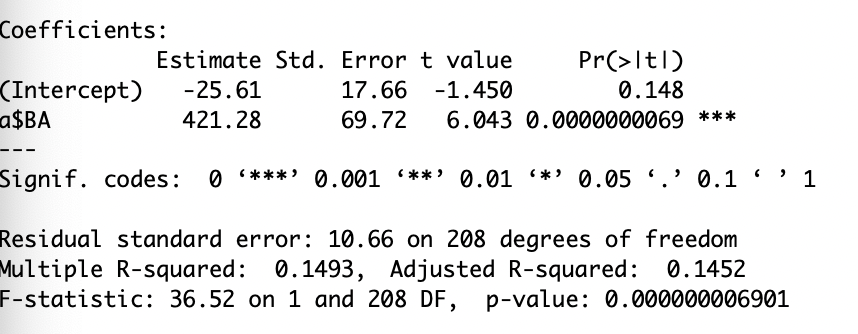
While having three stars next to my slope shows that batting average is statistically significant, I wanted to know how much variability existed between batting average and wins. The R-squared output showcases this variability. Using the same linear regression output, I was able to find that my data has an R-squared variable of .1493.
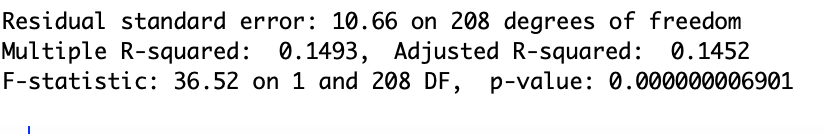
This, rounded up, means that 15% of the variability of wins can be explained by batting average. Having this low of a variability is means batting average is NOT a good indicator of wins. A percentage that would indicate that batting average was at least an ok indicator of wins would be at least 50%
