Over the last several blog posts I’ve been exploring the possibility that team batting average can help predict team wins. So far it hasn’t been much of a success with a weaker correlation between batting average and wins. There are still many factors that affect how many games a team will win in a season. This is where multiple regression comes in. Using a multiple regression equation, we might find a better correlation between two x variables and the y variable (wins) that I am trying to predict. Keeping wins as my intercept and batting average as a slope, I will now add BB (walks) as another x variable. This is because a team with higher walks puts more players on base eventually leading to more runs scored.

Using this equation I then received an output of 24.2 as the intercept (wins), 402.49 as a slope (BA), and -.09 as another slope (BB “walks”). This gives us the equation of Y=24.2+402.49(BA)-.09(BB). This means that when batting average and walks are 0 a team would have 24.2 wins.
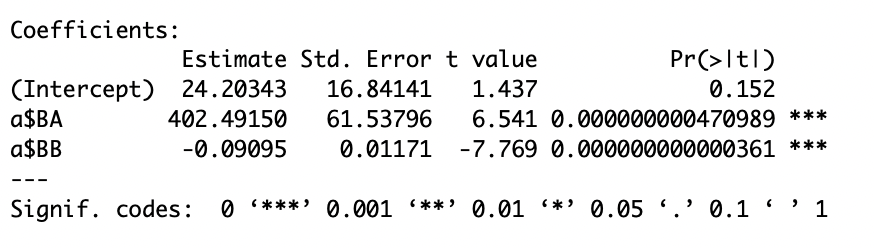
However, both batting average and walks have three starts meaning they are statistically significant and can be good indicators of wins. Also, both batting average and walks have a combined R-Sqaured value of .3414. This means that 34% of the variability in wins can be explained by batting average and walks. This is a little more than double the variability explained by just using batting average as an indicator (15%) meaning that both batting average and walks combined help predict wins more than just a single variable.
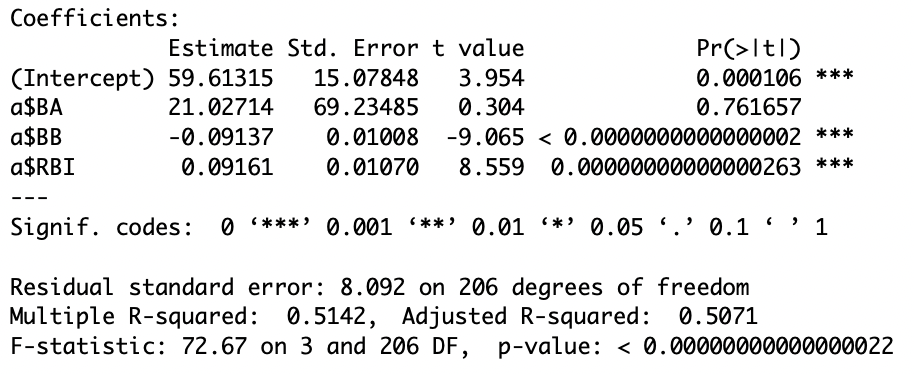
This also brings up the question, what if I used more than two predictors? When I add a third predictor into R, such as RBI’s, I get an R-Squared value of 51%. This means that over 50% of the variability in wins can be explained by batting average, walks, and RBI’s. Having a third variable adds much more confidence in predicting wins as we are now over 50% variability.