
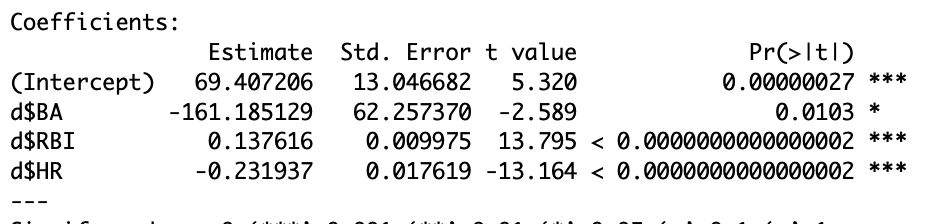
To test MLB data for multicollinearity I first needed to build a model that predicted Y. In the case of my data, I am looking to predict team wins. The three variables I’ve chosen to help predict wins are batting average (RBI), runs batted in (RBI’s), and home runs (HR). Using this model I then was able to see that 2 out of my X variables have high significance meaning that they can be good indicators of wins.
Now, using those three X variables I can find the correlation between them using the cor() function. This will show us whether this model has multicollinearity as well. The abbreviation in the model for each variable is used for the correlations table.

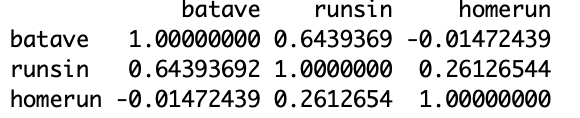
This output shows us the correlation between X variables. There is a .64 correlation between RBI’s and BA, a -0.015 correlation between HR and BA, and finally a .26 correlation between HR and RBI’s. The interesting variable in all of this is the correlation between home runs and batting average. Every time home runs increase by 1, batting average decreased by .014. Because the correlation between home runs and batting average and home runs and RBI’s is above a .25, that means the model suffers from multicollinearity. This means that there is a strong correlation between the predictors in my model
