
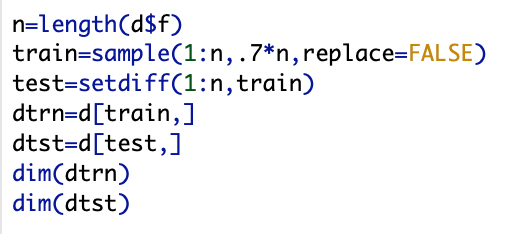
To asses the prediction accuracy and stability of my MLB dataset, I will now use the logistic regression model previously used in other posts. Firstly, I divided my data into training and test data sets. I selected 70% of team season statistics for the training set. Down bellow is code and dimensions for the new datasets.
Secondly, I build the logistic regression model to predict teams with a .500 winning percentage using home runs, walks, and runs batted in.

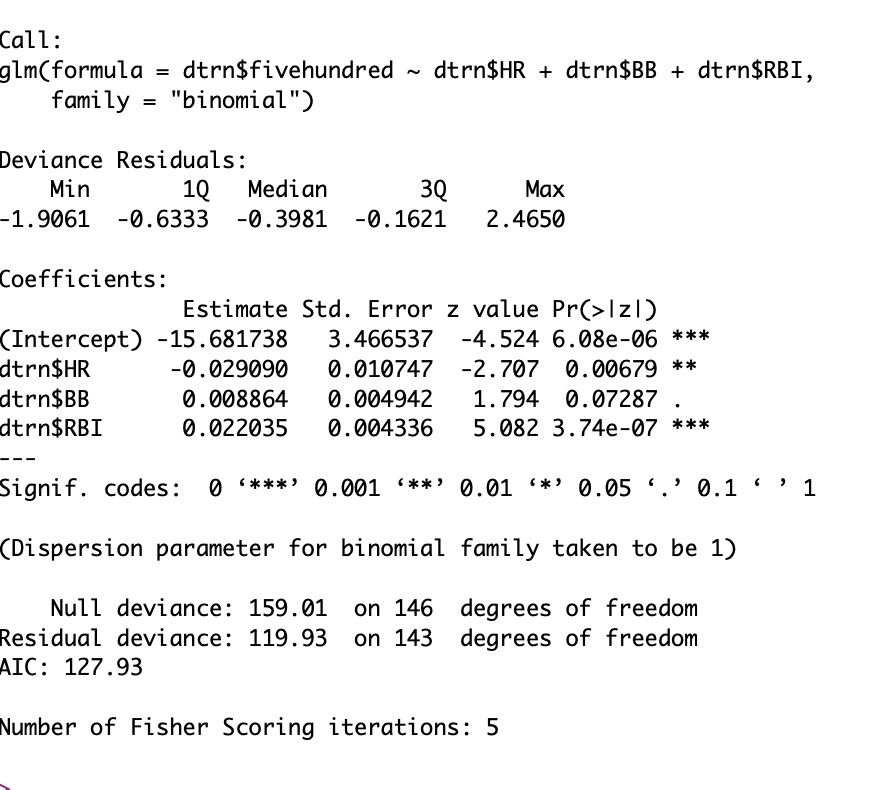
When I run the model for the training data set, it seems that home runs is a significant predictor. However significance also depends on what smaller set of data we use. Using this, my model equation is:
log(p/(1-p))=-15.61-.03*HR-.01*BB+.02*RBI, where P is probability that a team has a winning percentage over .500. Using this, I can make predictions using the model equation in the photo bellow.

Using these predictions, I can round predictions to 0 and 1’s, giving me a no or yes prediction for each subject.
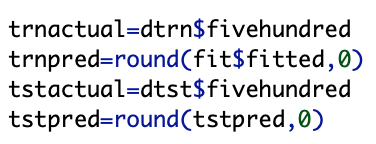
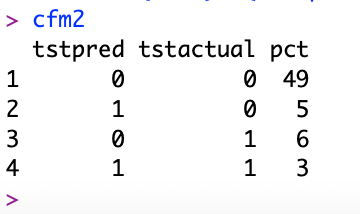
I can now use confusion matrices to compare trnpred and tstpred to actual values which are trnactual and tstactual. Listed bellow is R outputs for the matrices.
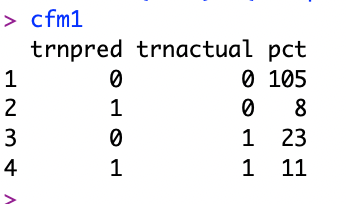
Because the percentages have quite a range, this means that the model is not quite stable. Also having percentages without a decimal point before hand means that there might be an error with my code. Further more, using cmf1 it shows that my model is inaccurate 128% of the time if you add up 105 and 23. So it looks as if this isn’t a very reliable model unless there is an issue with my code.
