
Firstly, I will create charts of Wins in a season per team against my three significant (and somewhat valuable) predictors).
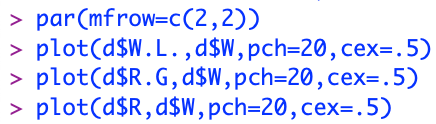
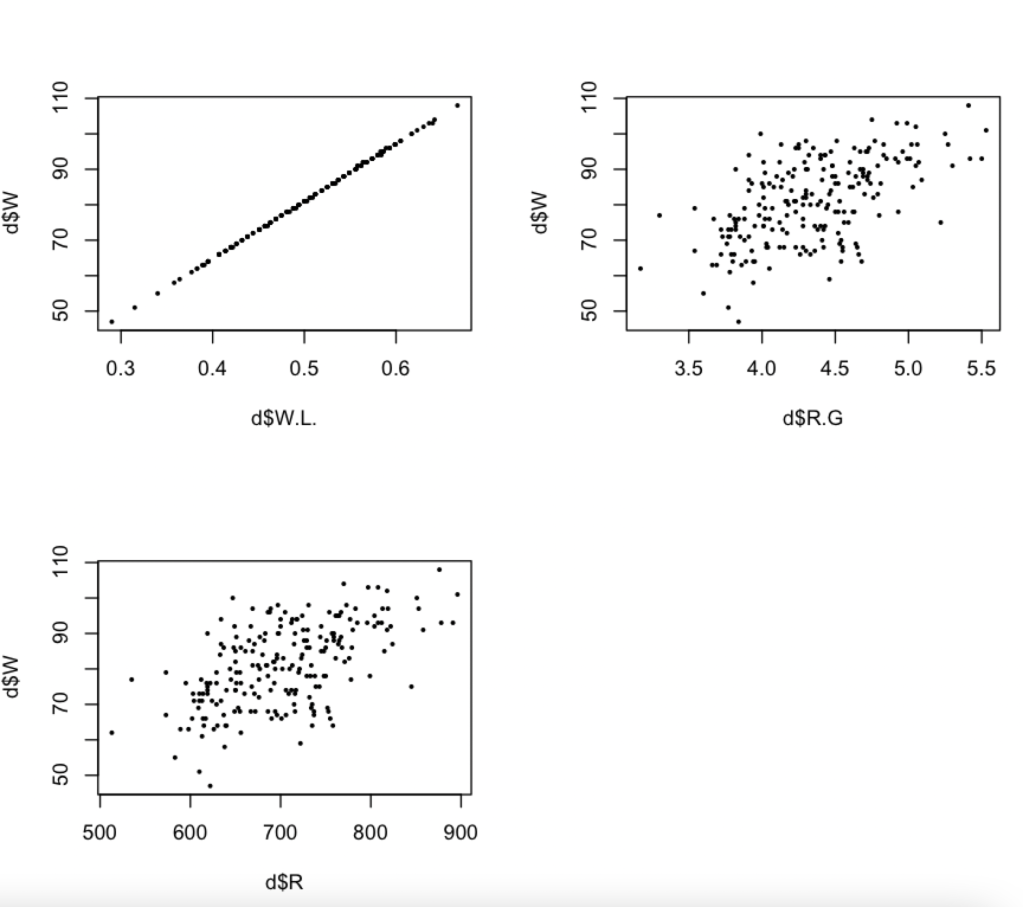
There does seem to be a few outliers in two of the charts. In the chart showing the relationship between wins and R.G, it seems that there are a couple observations bellow 3.5 and above 5.5 runs per game. In the relationship between wins and runs, it seems that there are also observations above 850 runs in a season and bellow 580 runs per season.
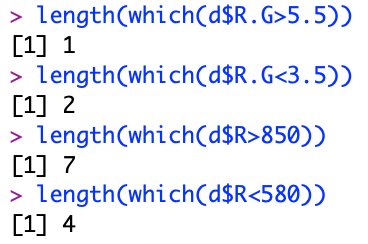
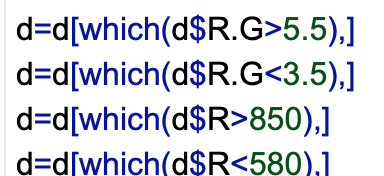
This shows that there are indeed outliers in the two charts mentioned. I will now remove those observations that are either too high or too low. Down bellow is the code I used to remove these specific observations.
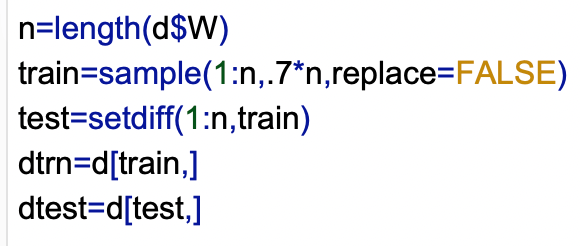
Now I will divide my data set to see if removing these outliers improves the fit of my model to the other observations in the data set. To divide the data set, I will use the same code I have used in previous posts.
Now I will run the same model to see if this affected the R-squared variable.
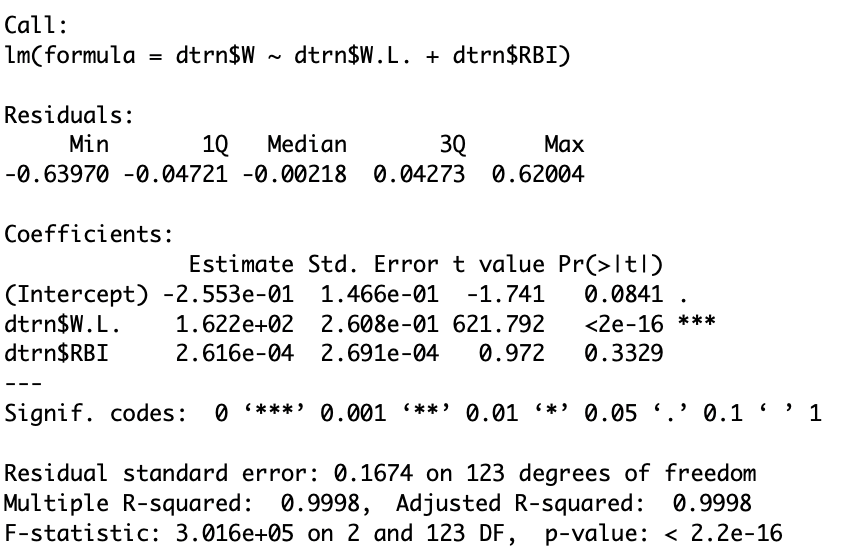
As you can see, my R-squared variable is basically the same as it was in the last blog post. This could be because there was so few outliers in my data set. This new R-squared variable shows that those outliers had little affect on the accuracy of my model.
